Statistics:
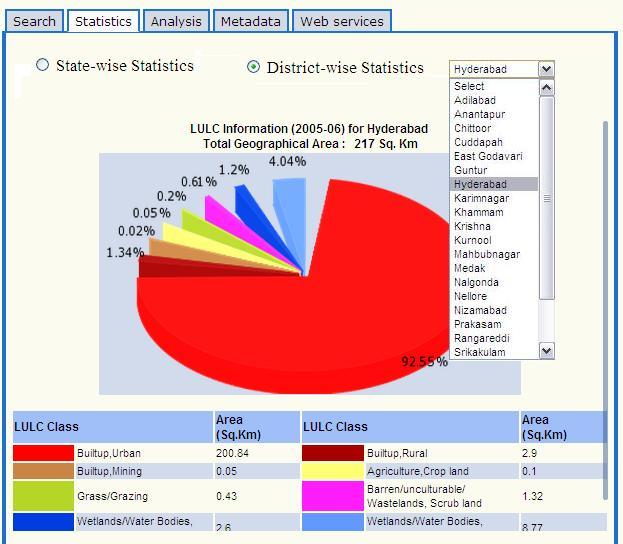
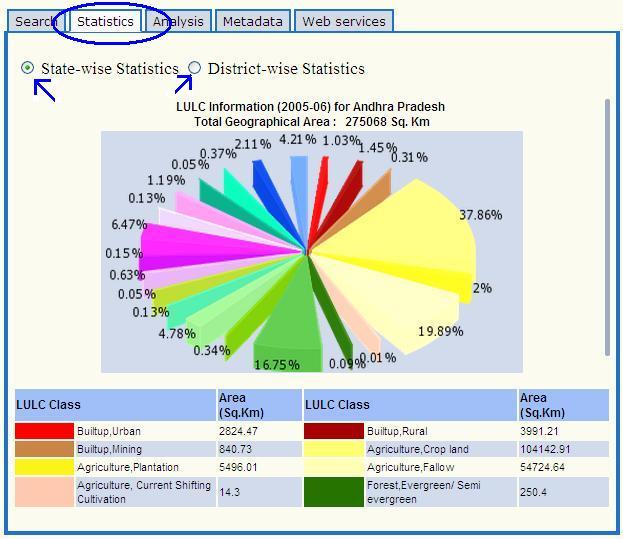
Statistics option gives the numerical figures about different LULC classes present in the selected (thematic) data. It also displays the pie-chart for the statistics. By default, it displays the statistics of the (thematic) data of the Geography/district selected.
If you are viewing the (thematic) data ‘Georaphy’ wise, statistics will be displayed of that ‘Georaphy’ but district wise option is also available.
If you are viewing district wise (thematic) data
in the viewer, statistics will be displayed for that particular
district.